Analysis

library(tidyverse)
── Attaching core tidyverse packages ──────────────────────── tidyverse 2.0.0 ──
✔ dplyr     1.1.4     ✔ readr     2.1.5
✔ forcats   1.0.0     ✔ stringr   1.5.1
✔ ggplot2   3.5.2     ✔ tibble    3.3.0
✔ lubridate 1.9.4     ✔ tidyr     1.3.1
✔ purrr     1.1.0     
── Conflicts ────────────────────────────────────────── tidyverse_conflicts() ──
✖ dplyr::filter() masks stats::filter()
✖ dplyr::lag()    masks stats::lag()
ℹ Use the conflicted package (<http://conflicted.r-lib.org/>) to force all conflicts to become errors
library(rnaturalearth)
library(dplyr)
library(ggplot2)
df_clean <- read_csv("data/df_clean.csv")
Rows: 615 Columns: 12
── Column specification ────────────────────────────────────────────────────────
Delimiter: ","
chr (2): country_of_origin, country_of_asylum
dbl (9): year, refugees_under_unhcrs_mandate, asylum_seekers, returned_refug...
lgl (1): other_people_in_need_of_international_protection

ℹ Use `spec()` to retrieve the full column specification for this data.
ℹ Specify the column types or set `show_col_types = FALSE` to quiet this message.

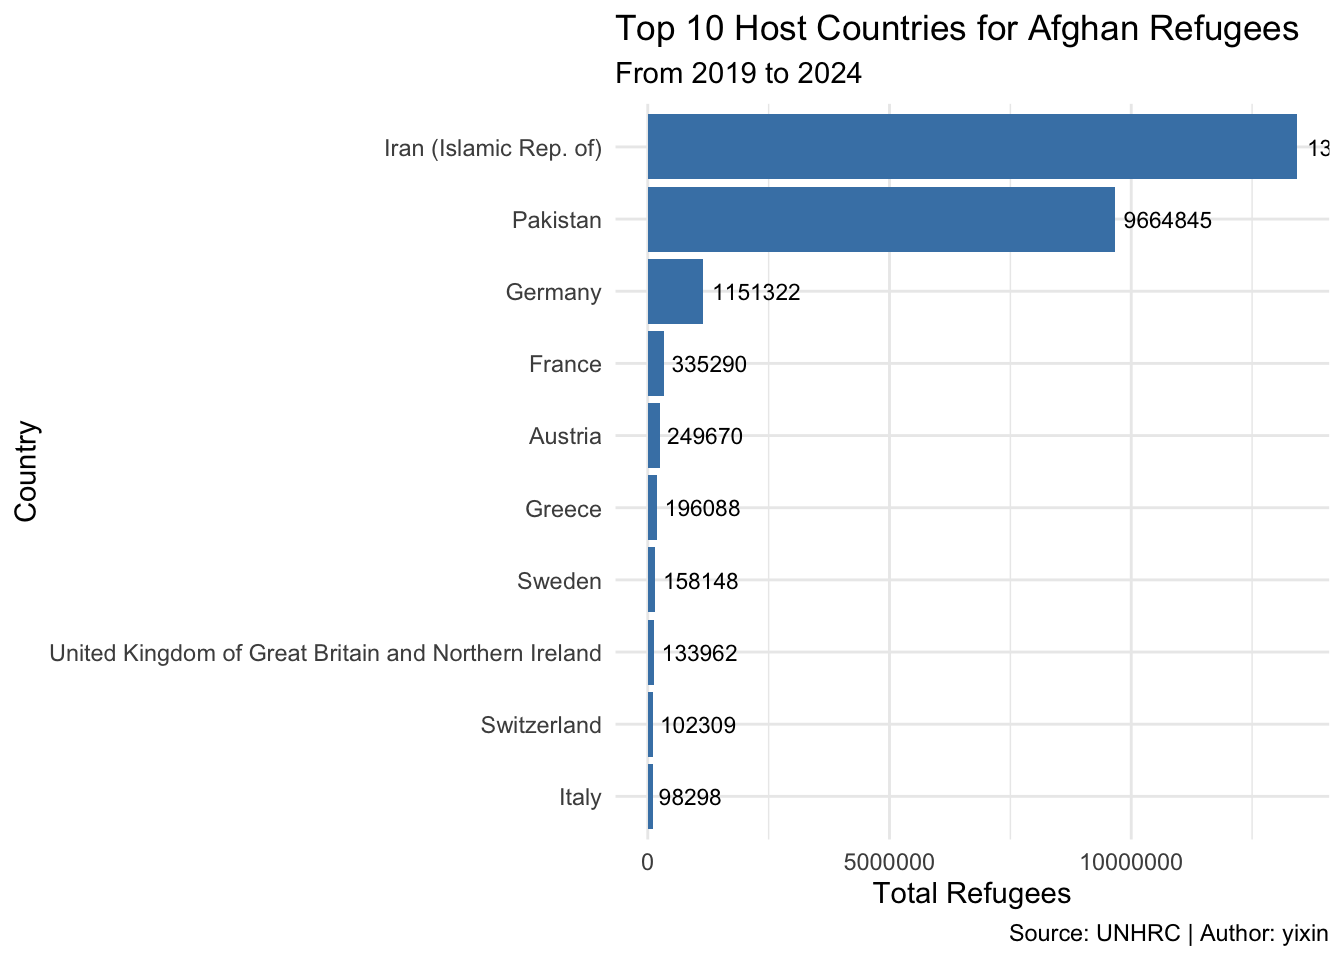
Q1: Which countries hosted the most Afghan refugees(2019–2024 total)?

q1 <- df_clean |>
  group_by(country_of_asylum) |>
  summarise(total_refugees = sum(refugees_under_unhcrs_mandate, na.rm = TRUE)) |>
  arrange(-total_refugees)

head(q1, 10)
# A tibble: 10 × 2
   country_of_asylum                                    total_refugees
   <chr>                                                         <dbl>
 1 Iran (Islamic Rep. of)                                     13427079
 2 Pakistan                                                    9664845
 3 Germany                                                     1151322
 4 France                                                       335290
 5 Austria                                                      249670
 6 Greece                                                       196088
 7 Sweden                                                       158148
 8 United Kingdom of Great Britain and Northern Ireland         133962
 9 Switzerland                                                  102309
10 Italy                                                         98298

Q1 visualization

options(scipen = 999)

top10 <- q1 |>
  arrange(desc(total_refugees)) |>
  head(10)

ggplot(top10, aes(x = reorder(country_of_asylum, total_refugees), y = total_refugees)) +
  geom_col(fill = "steelblue") +
  coord_flip() +
  labs(title = "Top 10 Host Countries for Afghan Refugees",
       subtitle = "From 2019 to 2024",
       x = "Country",
       y = "Total Refugees",
       caption = "Source: UNHRC | Author: yixin") +
  geom_text(aes(label = total_refugees),hjust = -0.1, size = 3) +
  theme_minimal() 

Q2 visualization

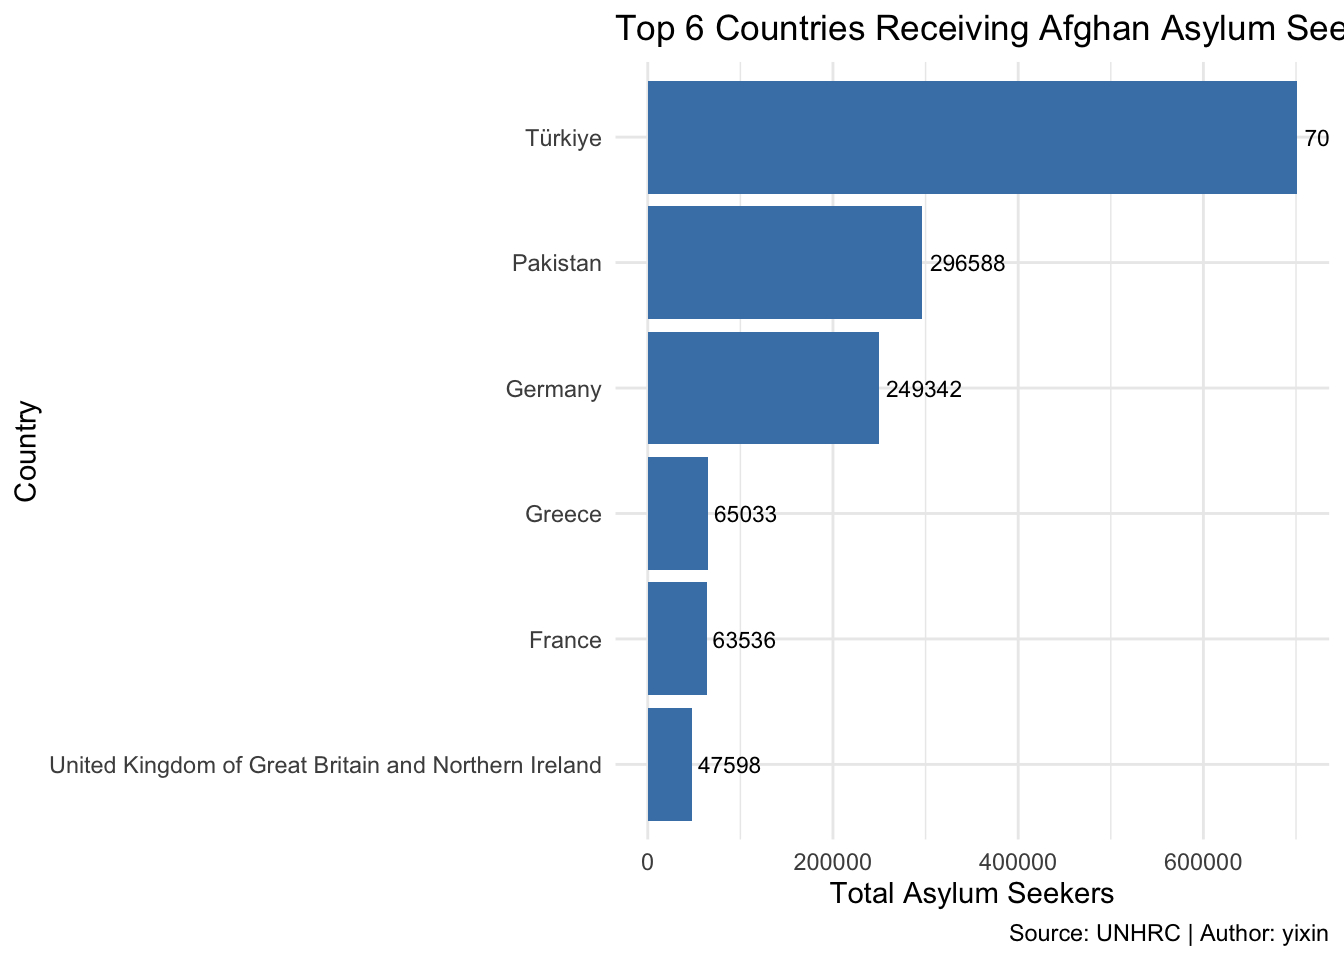
ggplot(top_countries, aes(x = reorder(country_of_asylum, total_asylum),y = total_asylum)) +
  geom_col(fill = "steelblue") +
  coord_flip() +
  labs(title = "Top 6 Countries Receiving Afghan Asylum Seekers (2019–2024)",
       x = "Country",
       y = "Total Asylum Seekers",
       fill = "Country",
       caption = "Source: UNHRC | Author: yixin") +
  geom_text(aes(label = total_asylum),hjust = -0.1, size = 3) +
  theme_minimal()

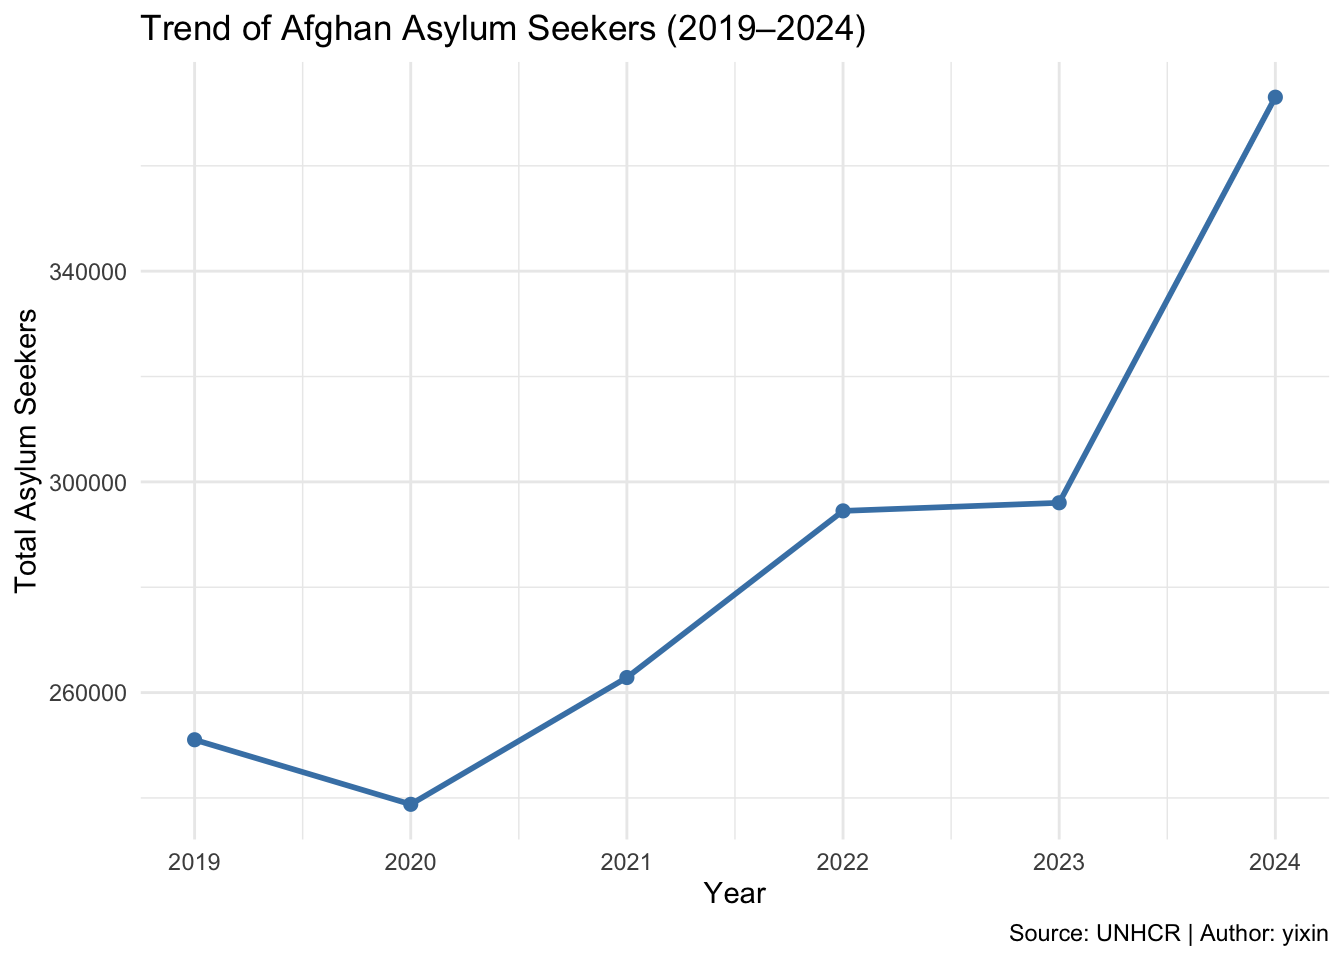
Q3: How did the total number of Afghan asylum seekers change from 2019 to 2024?

asylum_trend <- df_clean |>
  group_by(year) |>
  summarise(total_asylum_seekers = sum(asylum_seekers, na.rm = TRUE))

glimpse(asylum_trend)
Rows: 6
Columns: 2
$ year                 <dbl> 2019, 2020, 2021, 2022, 2023, 2024
$ total_asylum_seekers <dbl> 251047, 238791, 262860, 294493, 296033, 373027

Q3 visualization

ggplot(asylum_trend, aes(x = year, y = total_asylum_seekers)) +
  geom_line(color = "steelblue", size = 1) +
  geom_point(color = "steelblue", size = 2) +
  labs(title = "Trend of Afghan Asylum Seekers (2019–2024)",
       x = "Year",
       y = "Total Asylum Seekers",
    caption = "Source: UNHCR | Author: yixin") +
  theme_minimal()
Warning: Using `size` aesthetic for lines was deprecated in ggplot2 3.4.0.
ℹ Please use `linewidth` instead.

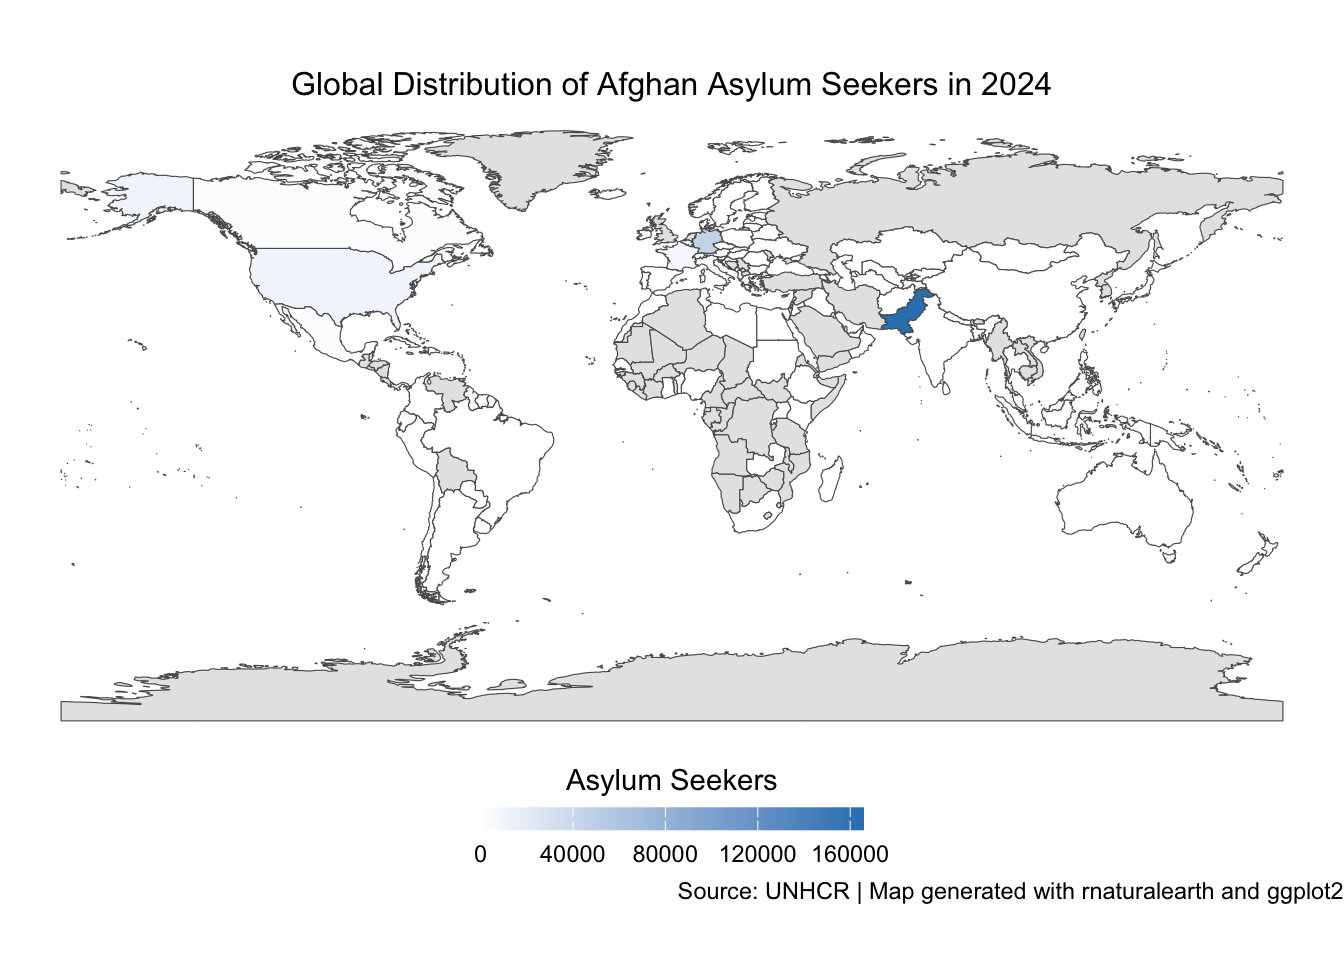
Q4: Global Distribution of Afghan Asylum Seekers in 2024

This visualization was assisted by ChatGPT (GPT-5.1)

library(dplyr)
library(ggplot2)
library(rnaturalearth)
library(rnaturalearthdata)

Attaching package: 'rnaturalearthdata'
The following object is masked from 'package:rnaturalearth':

    countries110
library(sf)
Warning: package 'sf' was built under R version 4.5.2
Linking to GEOS 3.13.0, GDAL 3.8.5, PROJ 9.5.1; sf_use_s2() is TRUE
world <- ne_countries(scale = "medium", returnclass = "sf")
asylum_2024 <- df_clean |>
  filter(year == 2024) |>
  group_by(country_of_asylum) |>
  summarise(total_asylum_seekers = sum(asylum_seekers, na.rm = TRUE))

glimpse(asylum_2024)
Rows: 111
Columns: 2
$ country_of_asylum    <chr> "Afghanistan", "Albania", "Argentina", "Armenia",…
$ total_asylum_seekers <dbl> 0, 0, 0, 6, 1461, 4416, 0, 5, 6, 5865, 12, 14, 26…
map_2024 <- world |>
  left_join(asylum_2024, by = c("name" = "country_of_asylum"))
ggplot(map_2024) +
  geom_sf(aes(fill = total_asylum_seekers)) +
  scale_fill_gradient(
    low = "white",
    high = "#3182bd",
    na.value = "grey90",
    name = "Asylum Seekers",
    guide = guide_colorbar(
      barwidth = 10,
      barheight = 0.6,
      title.position = "top",
      title.hjust = 0.5)) +
  labs(title = "Global Distribution of Afghan Asylum Seekers in 2024",
       caption = "Source: UNHCR | Map generated with rnaturalearth and ggplot2") +
  theme_void() +
  theme(plot.title = element_text(hjust = 0.5, size = 12),
        legend.position = "bottom")